Goodbye, census—hello, Street View
Google Street View provides panoramic still images at street level of a huge number of roads around the world. In many developed countries, the coverage is ubiquitous. And for many people, Google Street View has changed the way they explore and navigate.
But as a visual record of 21st-century society, Street View has the potential to reveal much more. Last year, researchers used these images to analyze the demographic makeup of a wide range of US cities.
Now Rahul Goel at the University of Cambridge in the UK and a few pals have used Street View images to tease apart the way people use different types of transport in Britain. They say the technique provides a relatively quick, large-scale method to assess transport patterns, the effect of changes in transport policy, and even the exercise habits of the population.
The technique is relatively straightforward. The team picked 1,000 random locations in 34 cities across Great Britain. For each of these locations, they downloaded the panoramic Google Street View images from 2011 or thereabouts, and manually counted the number of pedestrians, cyclists, motorcycles, and cars. They also worked out whether cyclists were male or female.
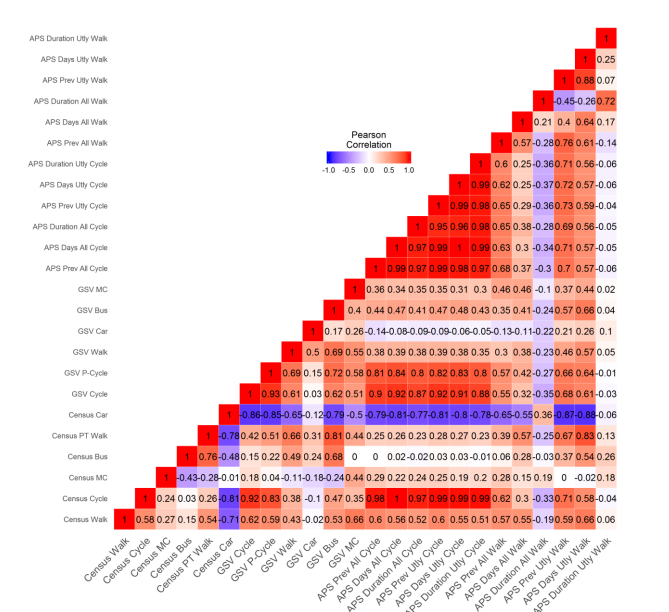
At the same time, the team gathered data from the 2001 UK Censusand the Active People Survey that has been carried out in the UK since 2005. These surveys record the demographic distribution in each area, how people generally travel to work, and how much time they spend walking, cycling, and so on. This data is a kind of ground truth against which Goel and co can compare the Street View observations.
The results provide a unique snapshot of travel patterns. Goel and co say the Street View observations correspond well with the data gathered by conventional means. For example, they say that in Street View images, male cyclists outnumber female cyclists by about two to one, an observation that corresponds with other data.
And the Street View images correlate with reported activity levels. “We also found that Google Street View observations are strong predictors of the past-month cycling activity levels reported by the Active People Survey,” say Goel and co, adding: “Street imagery is a promising new big data source to predict urban mobility patterns.”

There are some limitations, of course. Google Street View does not say what time or day of the week the images were taken, and these factors are likely to have a significant effect on travel patterns.
But the technique certainly has advantages over conventional surveys, which often rely on self-reported activity levels that are not always accurate.
Goel and co say there is certainly more that can be gleaned in the future. For example, the team looked at images from 2011, but Street View has been recording images since 2007 and thus has the potential to reveal how travel patterns are changing over time.
And unusually, the team analyzed all the images manually. Clearly, it would be possible to analyze a much bigger data set using machine vision to spot pedestrians, cyclists, and motorists. So there is potential to expand this technique considerably.
More broadly, Street View can be a significant additional source of information for demographers, health experts, and policy makers. And this is clearly just the start: it’s not hard to imagine how the images could reveal all kinds of other changes in society over time, such as clothing fashions, hairstyles, vehicle sales, and so on.
There’s plenty more gold in them thar hills! And that is likely to inflame the debate over what kind of information Street View can record and whether society should have a bigger say in that question. In Germany, for example, people have much more control over what Street View can record. This kind of work will clearly sharpen the debate.
Ref: arxiv.org/abs/1802.02915 : Estimating City-Level Travel Patterns Using Street Imagery: A Case Study Of Using Google Street View In Britain
Keep Reading
Most Popular
Large language models can do jaw-dropping things. But nobody knows exactly why.
And that's a problem. Figuring it out is one of the biggest scientific puzzles of our time and a crucial step towards controlling more powerful future models.
The problem with plug-in hybrids? Their drivers.
Plug-in hybrids are often sold as a transition to EVs, but new data from Europe shows we’re still underestimating the emissions they produce.
Google DeepMind’s new generative model makes Super Mario–like games from scratch
Genie learns how to control games by watching hours and hours of video. It could help train next-gen robots too.
How scientists traced a mysterious covid case back to six toilets
When wastewater surveillance turns into a hunt for a single infected individual, the ethics get tricky.
Stay connected
Get the latest updates from
MIT Technology Review
Discover special offers, top stories, upcoming events, and more.